
The Science of Prosperity
Education as measured by the years of schooling, shows a remarkable strong positive cross-country correlation with GDP per capita. This correlation not only holds today, but has been fairly persistent since education became broad based in western societies, some 150 years ago. During that era governments began facilitating education for common people and started to abandon child labor.
Generally, the average years of education of a nation’s inhabitants is a fairly good predictor of its average GDP per capita. For instance in 2010, the world wide cross section of the average years of education, explains the logarithmic GDP per capita in a linear regression with a degree of predictability of around 0.7, as gauged by the Ordinary Least Squares (OLS) regressions on both the educational Clio Infra database as well as the Barro & Lee database show a high degree of explanation.
In the period 1870-2010, this degree of explanation, implied an increasing correlation between GDP per capita and education, especially for the Barro & Lee (2010) database. Both the slope and the intercept of the respective regressions in the period 1870-1970 hardly moved. Only after this period the slope trended up while the intercept trended down, both suggesting a growing importance of education to welfare.
The intercept might probably be considered a proxy for the Malthusian subsistence level, marking the annual income per capita without any education. Probably this regression intercept has become less meaningful in the last 50 years because the number of countries with GDP per capita near the subsistence level has been significantly reduced. This makes inferences harder when there are no data points near the zero-education intercept. However, the declining intercept of the last decades suggests that countries cannot survive without education anymore, making broad based schooling even more crucial. The increasing slope of the regressions in the last 50 years points toward the same with a the growing importance of education as a driver for economic prosperity.
Additionally, regressions on the Barro & Lee database show that distinctions in years of schooling in primary, secondary or tertiary education do not add additionally explanatory power to GDP per Capita, nor do gender distinctions. Only the average years of secondary education comes close to the explanatory power of total average years of education. Total schooling probably is more powerful in explaining GDP per capita than the primary, secondary and tertiary schooling separately due to difficulties in comparing those education levels internationally.
Looking closer into geographical differences it seems that
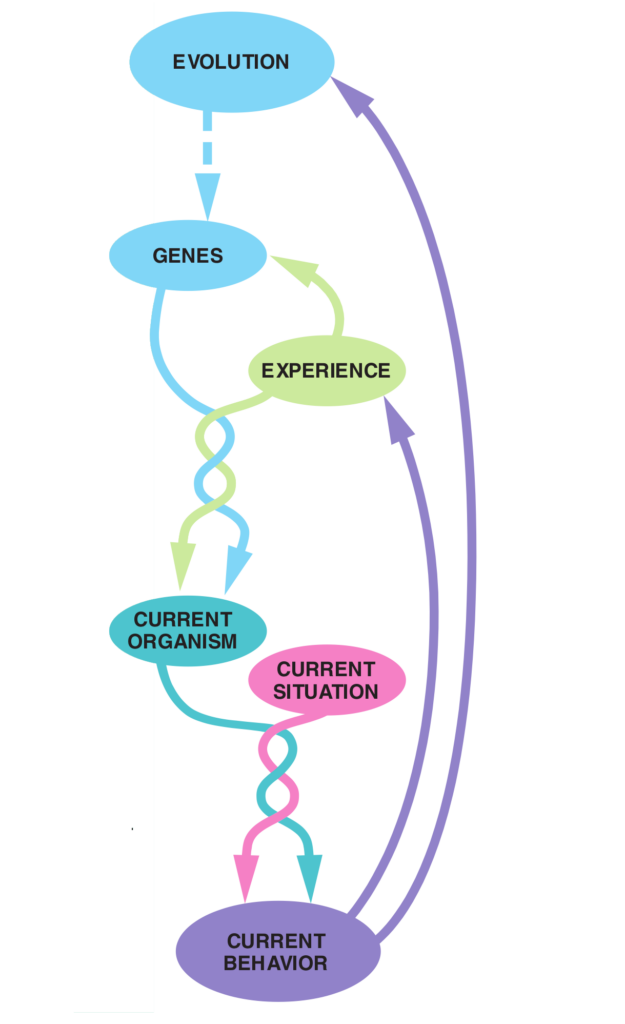
Causality between GDP per capita and education: a balanced feedback loop
A single, one way, causal relation between GDP per capita and education is hard to establish. Most plausible is that the relation is a balanced feedback loop. Feedback loop in the sense that average years of education positively impacts GDP per capita and vice versa. Balanced in the sense that there is no dominating causality between the two factors. Both directions of causality have been proposed in academic literature. That human capital, generated through schooling, spurs economic growth and creates prosperity is for instance hypothesized by Barro (1991), Barro and Sala-i-Martin (1995), Benhabib and Spiegel (1994), De la Fuente and Domenech (2006) and Hanushek and Kimko (2000). The opposite causality has been proposed for instance by Brückner and Gradstein (2013). Most likely both directions are true. The interactive graph between average years of education and GDP per capita shows that past education explains future GDP per capita, but also the opposite is equally true. Past GDP per capita explains future levels of education on the other hand equally well.
Some economists estimate that the direct (causal) impact of the education boom of the twentieth century was significant. According to Goldin & Katz, the direct effect of educational attainment on labor quality accounted for about 15% of the total rise in GDP per capita over the period 1915-2005. Goldin & Katz found that rising labor quality due to increased schooling boosted the effective size of the work force by 0.48% per year during 1915-2015. Ho & Jorgenson and Aaronson & Sullivan using similar methods have reached similar results. Aaronson & Sullivan looked at the combined effects of education, experience levels, and gender composition and found that labor quality rose by 0.33% per year during 1964-2000.
The vicious cycle stylistically depicted in the display to the left is in reality more complex. In the first place, a complicating and likely also accelerating additional factor is life expectancy or, more generally, health. Higher GDP per capita leads generally to a higher life expectancy and better health. This leads to an increase of productive years per capita and therefore a higher return on education. Increased life expectancy can lead to even further increases in years of schooling. In the second place, schooling is not entirely motivated by enhancing human capital but is also driven by the signalling function of educational degrees. Therefore education could serve as a proof rather than an acquisition of capabilities. This signalling function can however not explain the strong positive cross country relation between average years of education and GDP per capita as shown in the first graph. Most likely education both serves as signalling as well as acquiring human capital, which in turn leads to higher GDP per capita. In the third place, intelligence and therefore education could be described evolutionary as an ornamentation. Like the peacocks tail it could signal fitness as a big brain needs disproportionally large amounts of energy. In that sense education could also be an evolutionary side effect rather than the cause of wealth.
References:
Barro, R (1991) – Economic Growth in a Cross Section of Countries.” Quarterly Journal of Economics, 106(2), 407-44.
Barro, R and X Sala-i-Martin (1995) – Economic Growth, New York, McGraw Hill.
Benhabib, J and M Spiegel (1994) – The Role of Human Capital in Economic Development: Evidence from Aggregate Cross-Country Data, Journal of Monetary Economics 32, 143-174.
Bils, M and P Klenow (2000) – Does schooling cause growth?, The American Economic Review 90, 1160-1183.
Brückner, Markus and Mark Gradstein (2013) – Income and schooling, CEPR discussion paper, Centre for Economic Policy Research.
De la Fuente, A and Domenech, R (2006) – Human capital in growth regression: How much difference does quality data make?”, Journal of the European Economic Association, 4(1), 1–36.
Hanushek, Eric A, and Dennis D Kimko (2000) – Schooling, labor force quality, and the growth of nations, The American Economic Review 90, 1184-1208.
Dale W. Jorgenson and Mun S. Ho (1999) – The Quality of the U.S. Work Force, 1948–95
Daniel Aaronson and Daniel Sullivan (2001) – Growth in Worker Quality, 53–74
To do:
-Skill premium. Before 1870 education substantial enough to prove a positive relation between schooling and wealth on a nationwide scale. However [,,] showed a positive skill premium in England since 1250(?).
-Variationcoefficient since 1870 in continuous decline
-what does the low interest environment (and inflation) do to the return on invested human capital?? Debt/inflation
-Draw graph of payoff throughout time of individual starting working at 12 (Malthus) and at 25 (modern growth). Is ther an optimum age to average years of schooling? Depending on interest rarest?
-Life expectations and AYE?